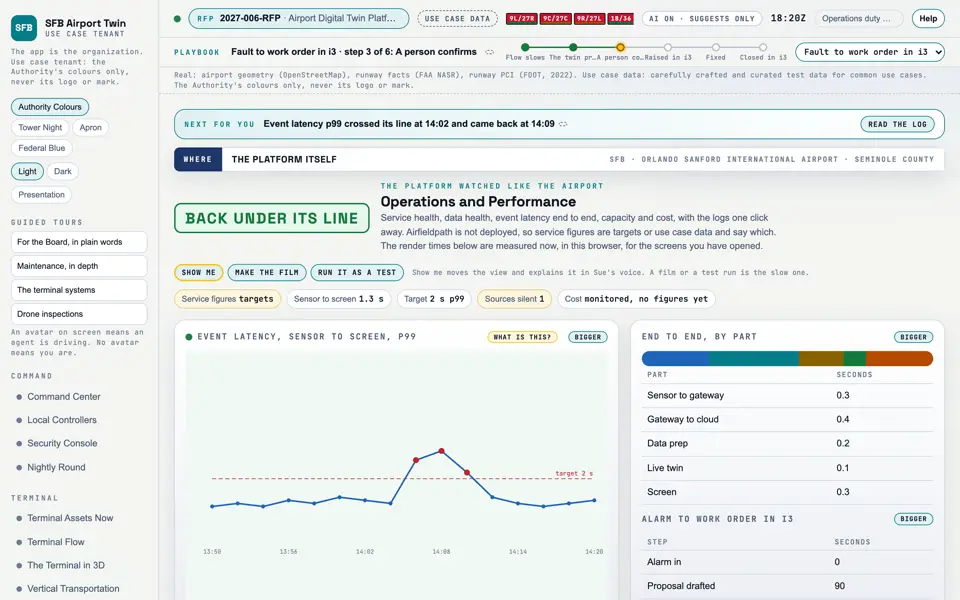
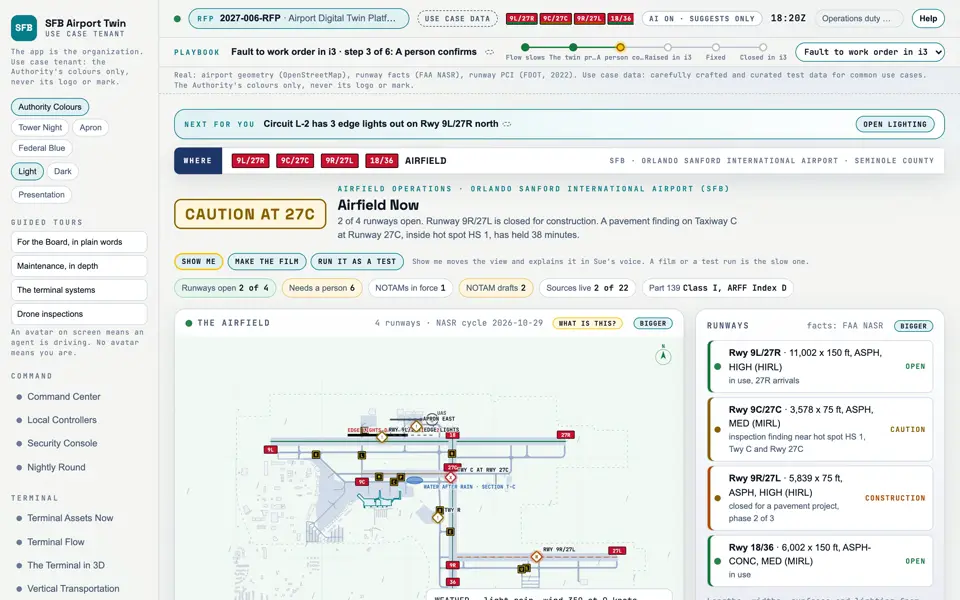
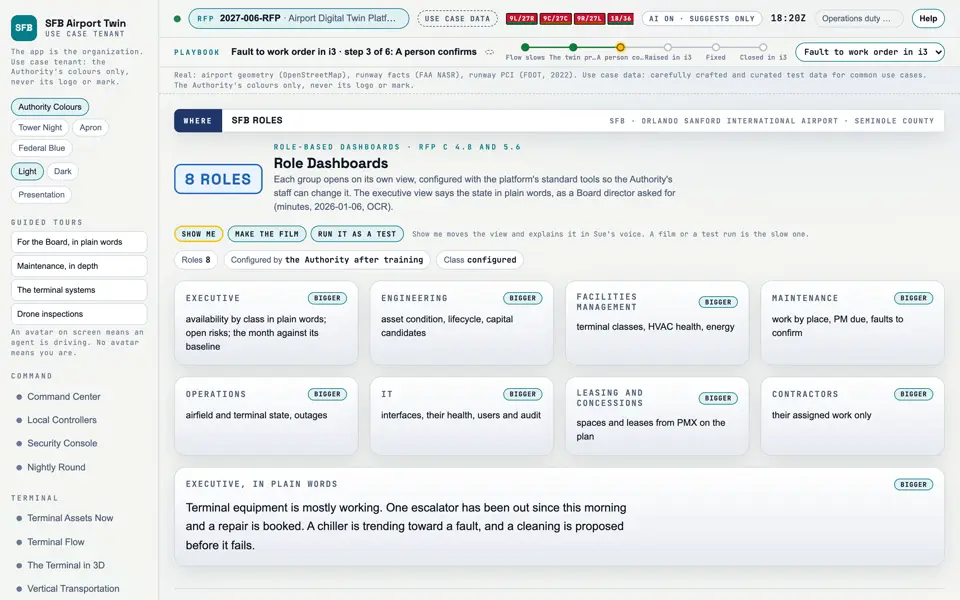
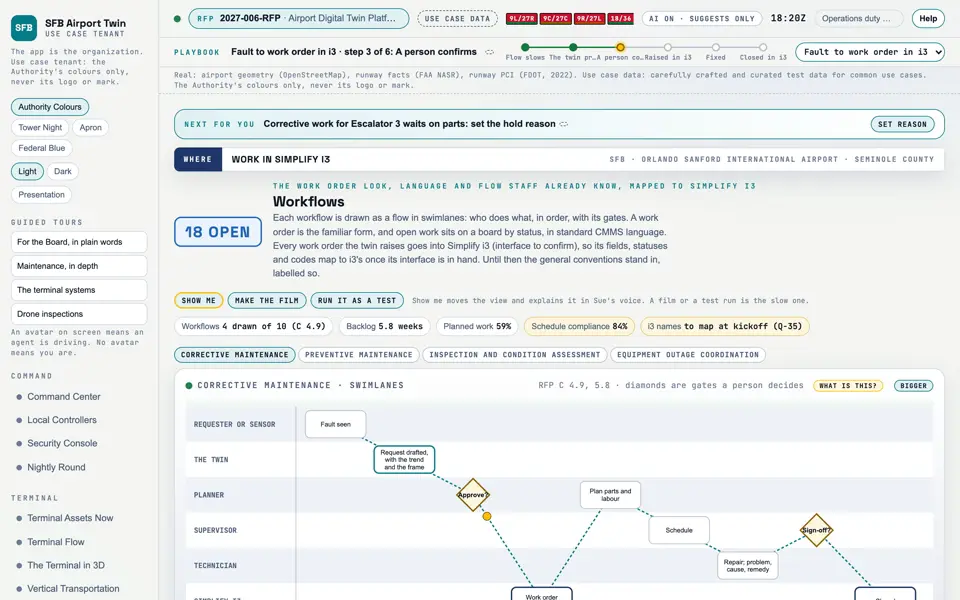
The loop from reporting to decision to analytics to events to action, and what exists today.
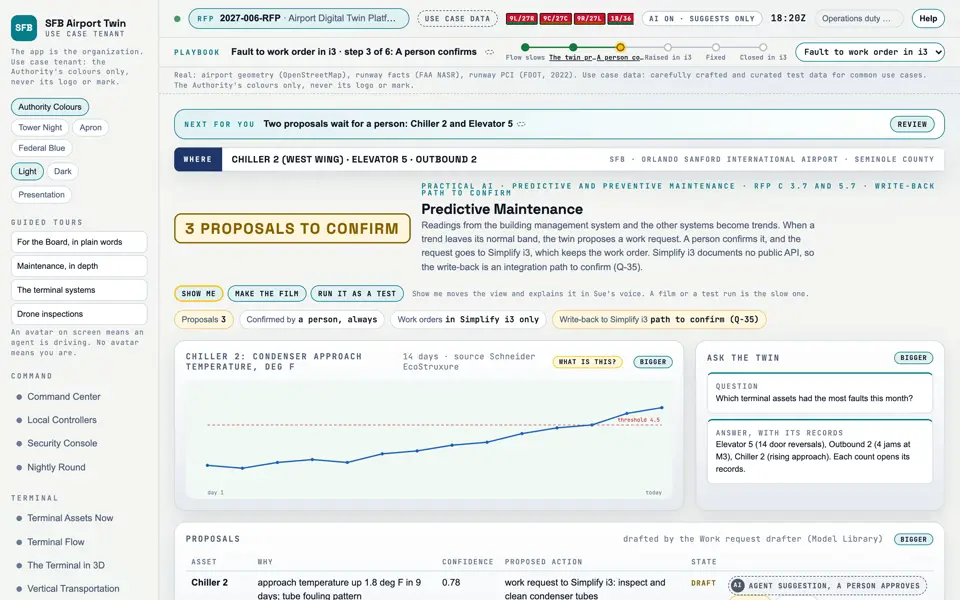
Analytics. Headless capture of poc/index.html?v=predict&m=light, as the proof of concept renders it, 1400 by 875 at 2x scale.
The loop
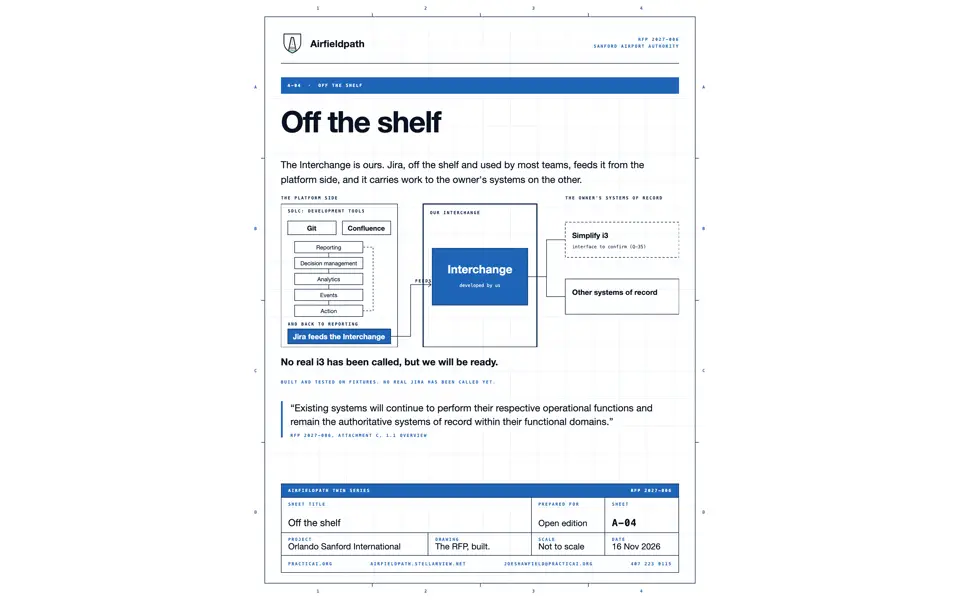
Analytics sits in a loop. Reporting shows where things stand. Decision management says who is told and who approves. Analytics finds what is changing. Events name what happened. Action records the work. The result goes back to reporting (sheet A-04).
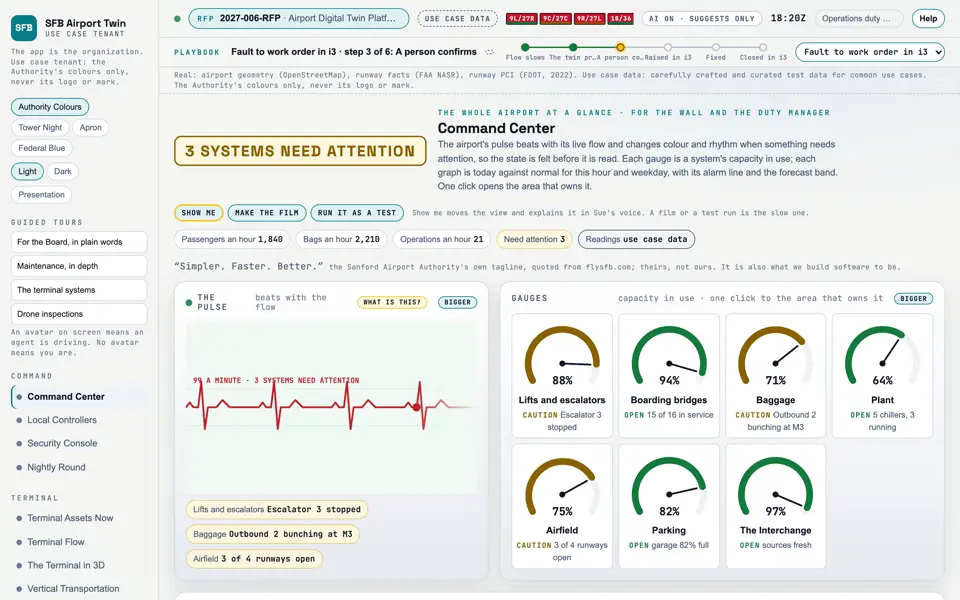
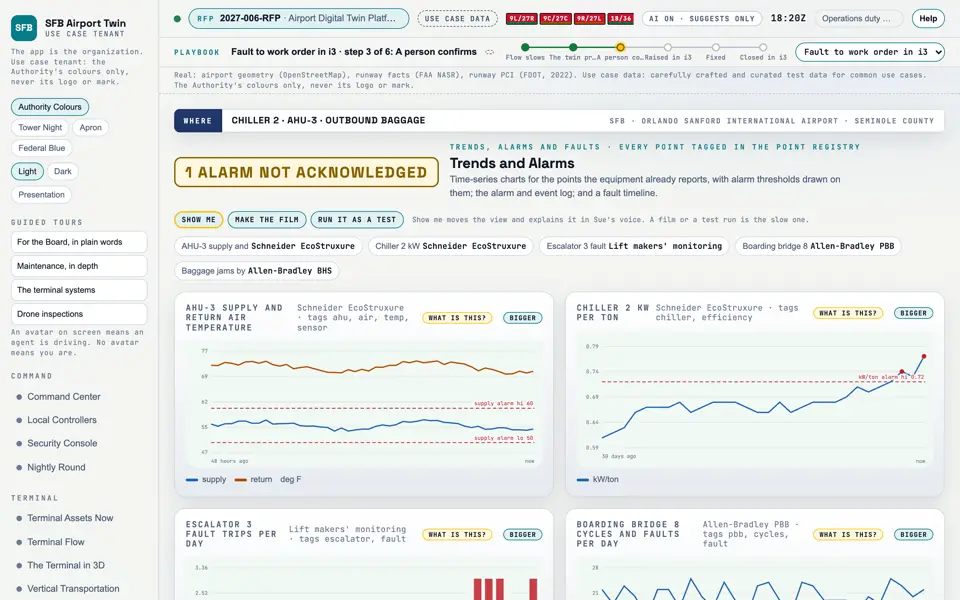
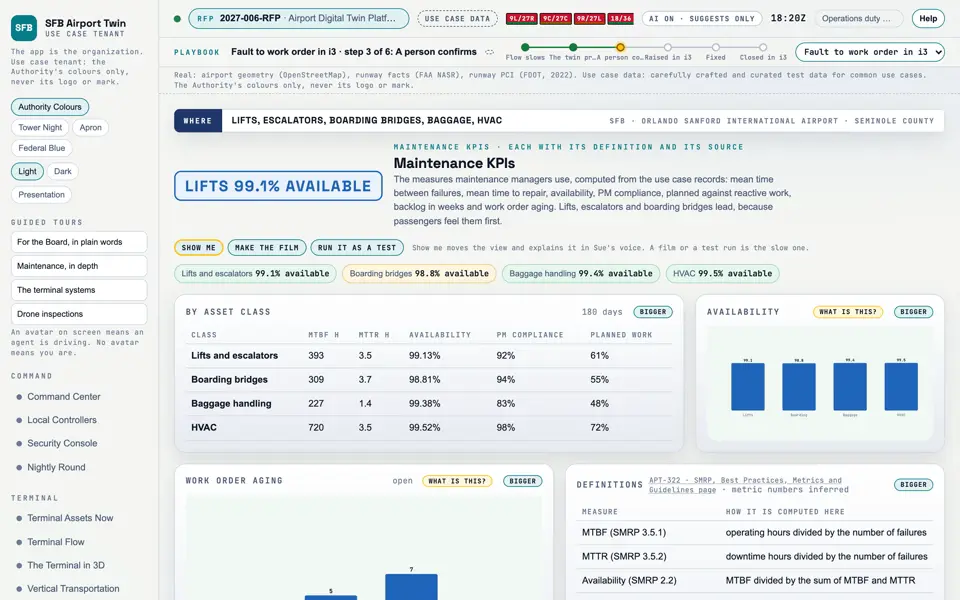
In the proof of concept the loop runs on the screens named below, on carefully crafted and curated test data for common use cases. Trends and Alarms shows readings over time with alarm lines and a forecast band. Predictive Maintenance proposes a repair for a person to approve. Maintenance KPIs shows whether maintenance is getting better.
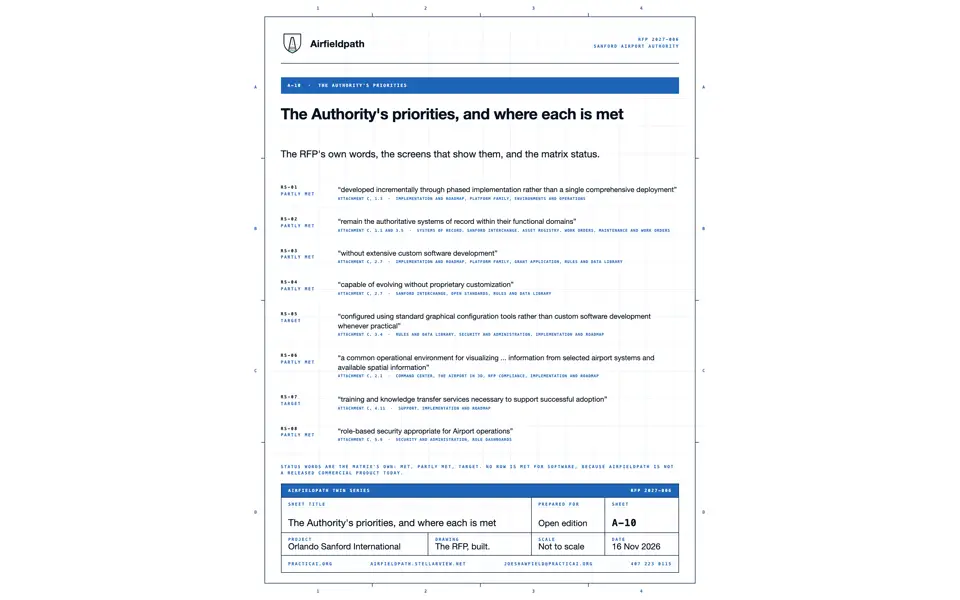
The status of each requirement row that names these screens is shown on the row and in the list below, in the words the matrix uses: met, partly met, target or not offered. Where a row says target, the capability is designed and not shown.
Components for Analytics
12 components on this site relate to this explainer: 3 document, 9 screen. The best 6 are shown.
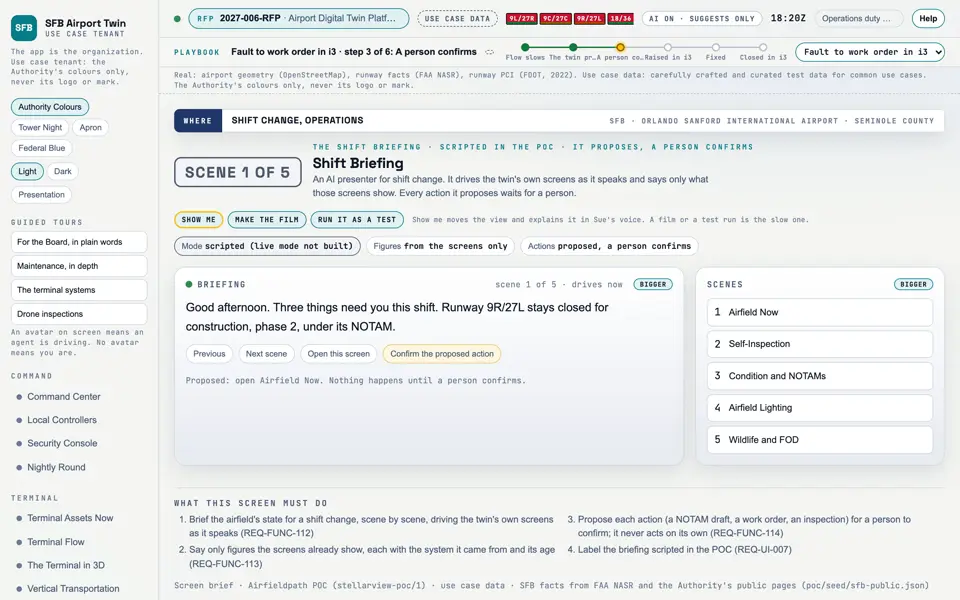
Picture: Headless capture of poc/index.html?v=command&m=light, as the proof of concept renders it, 1400 by 875 at 2x scale. Clip: Capture of poc/index.html?v=command&m=light, 4 seconds of the screen as it runs, 10 frames a second. No sound.
Picture: Headless capture of poc/index.html?v=predict&m=light, as the proof of concept renders it, 1400 by 875 at 2x scale. Clip: Excerpt of poc/flybys/terminal-fault.mp4, 1.9 to 6.0 seconds. A drawing of the process: A terminal fault: trend, prediction, work order. No sound.
Picture: Headless capture of poc/index.html?v=now&m=light, as the proof of concept renders it, 1400 by 875 at 2x scale. Clip: Excerpt of poc/flybys/pooling.mp4, 2.0 to 6.0 seconds. A drawing of the process: A storm cell, water on the pavement, a work order. No sound.