2.25 · Proof of concept · Connect
Operations and Performance Real
How the platform itself is doing: service health, data health, latency end to end, capacity, cost and the logs.
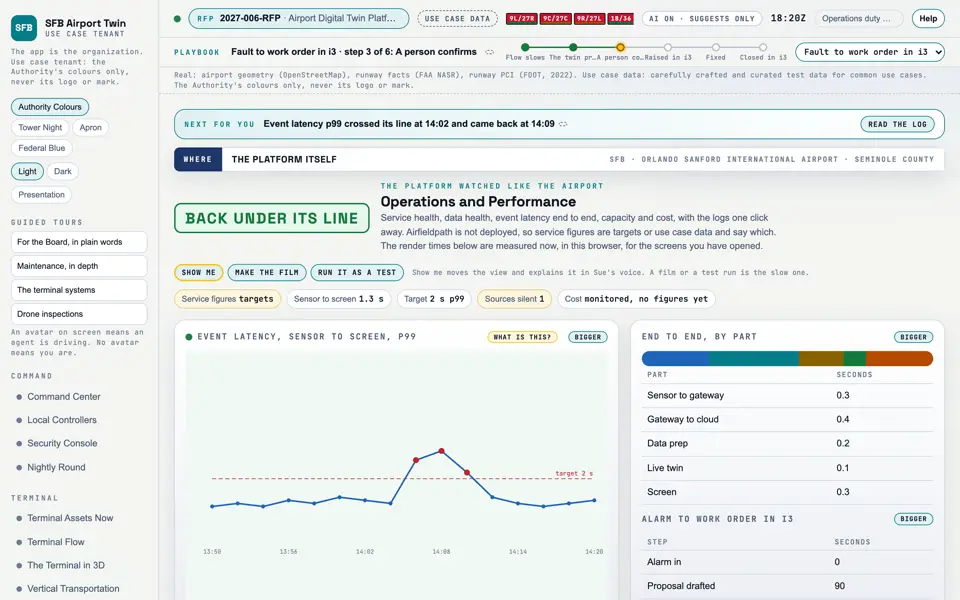
Picture: Headless capture of poc/index.html?v=ops&m=light, as the proof of concept renders it, 1400 by 875 at 2x scale.
Screen · Proof of concept · Connect
How the platform itself is doing: service health, data health, latency end to end, capacity, cost and the logs.
- Sources
- Interchange
- Twin
- Screens
- Plan
- Kind
- Screen
- Status
- not linked
- Airport layer
- Screens: the POC story and the spines
- Airport area
- not linked
- System
- not linked
- Sensor type
- not linked
Open the screen · Open the detail
Level 2 of 3 This component, complete on its own. Its files, sources and tests are the detail below. Open the detail
Open this screen in the proof of concept
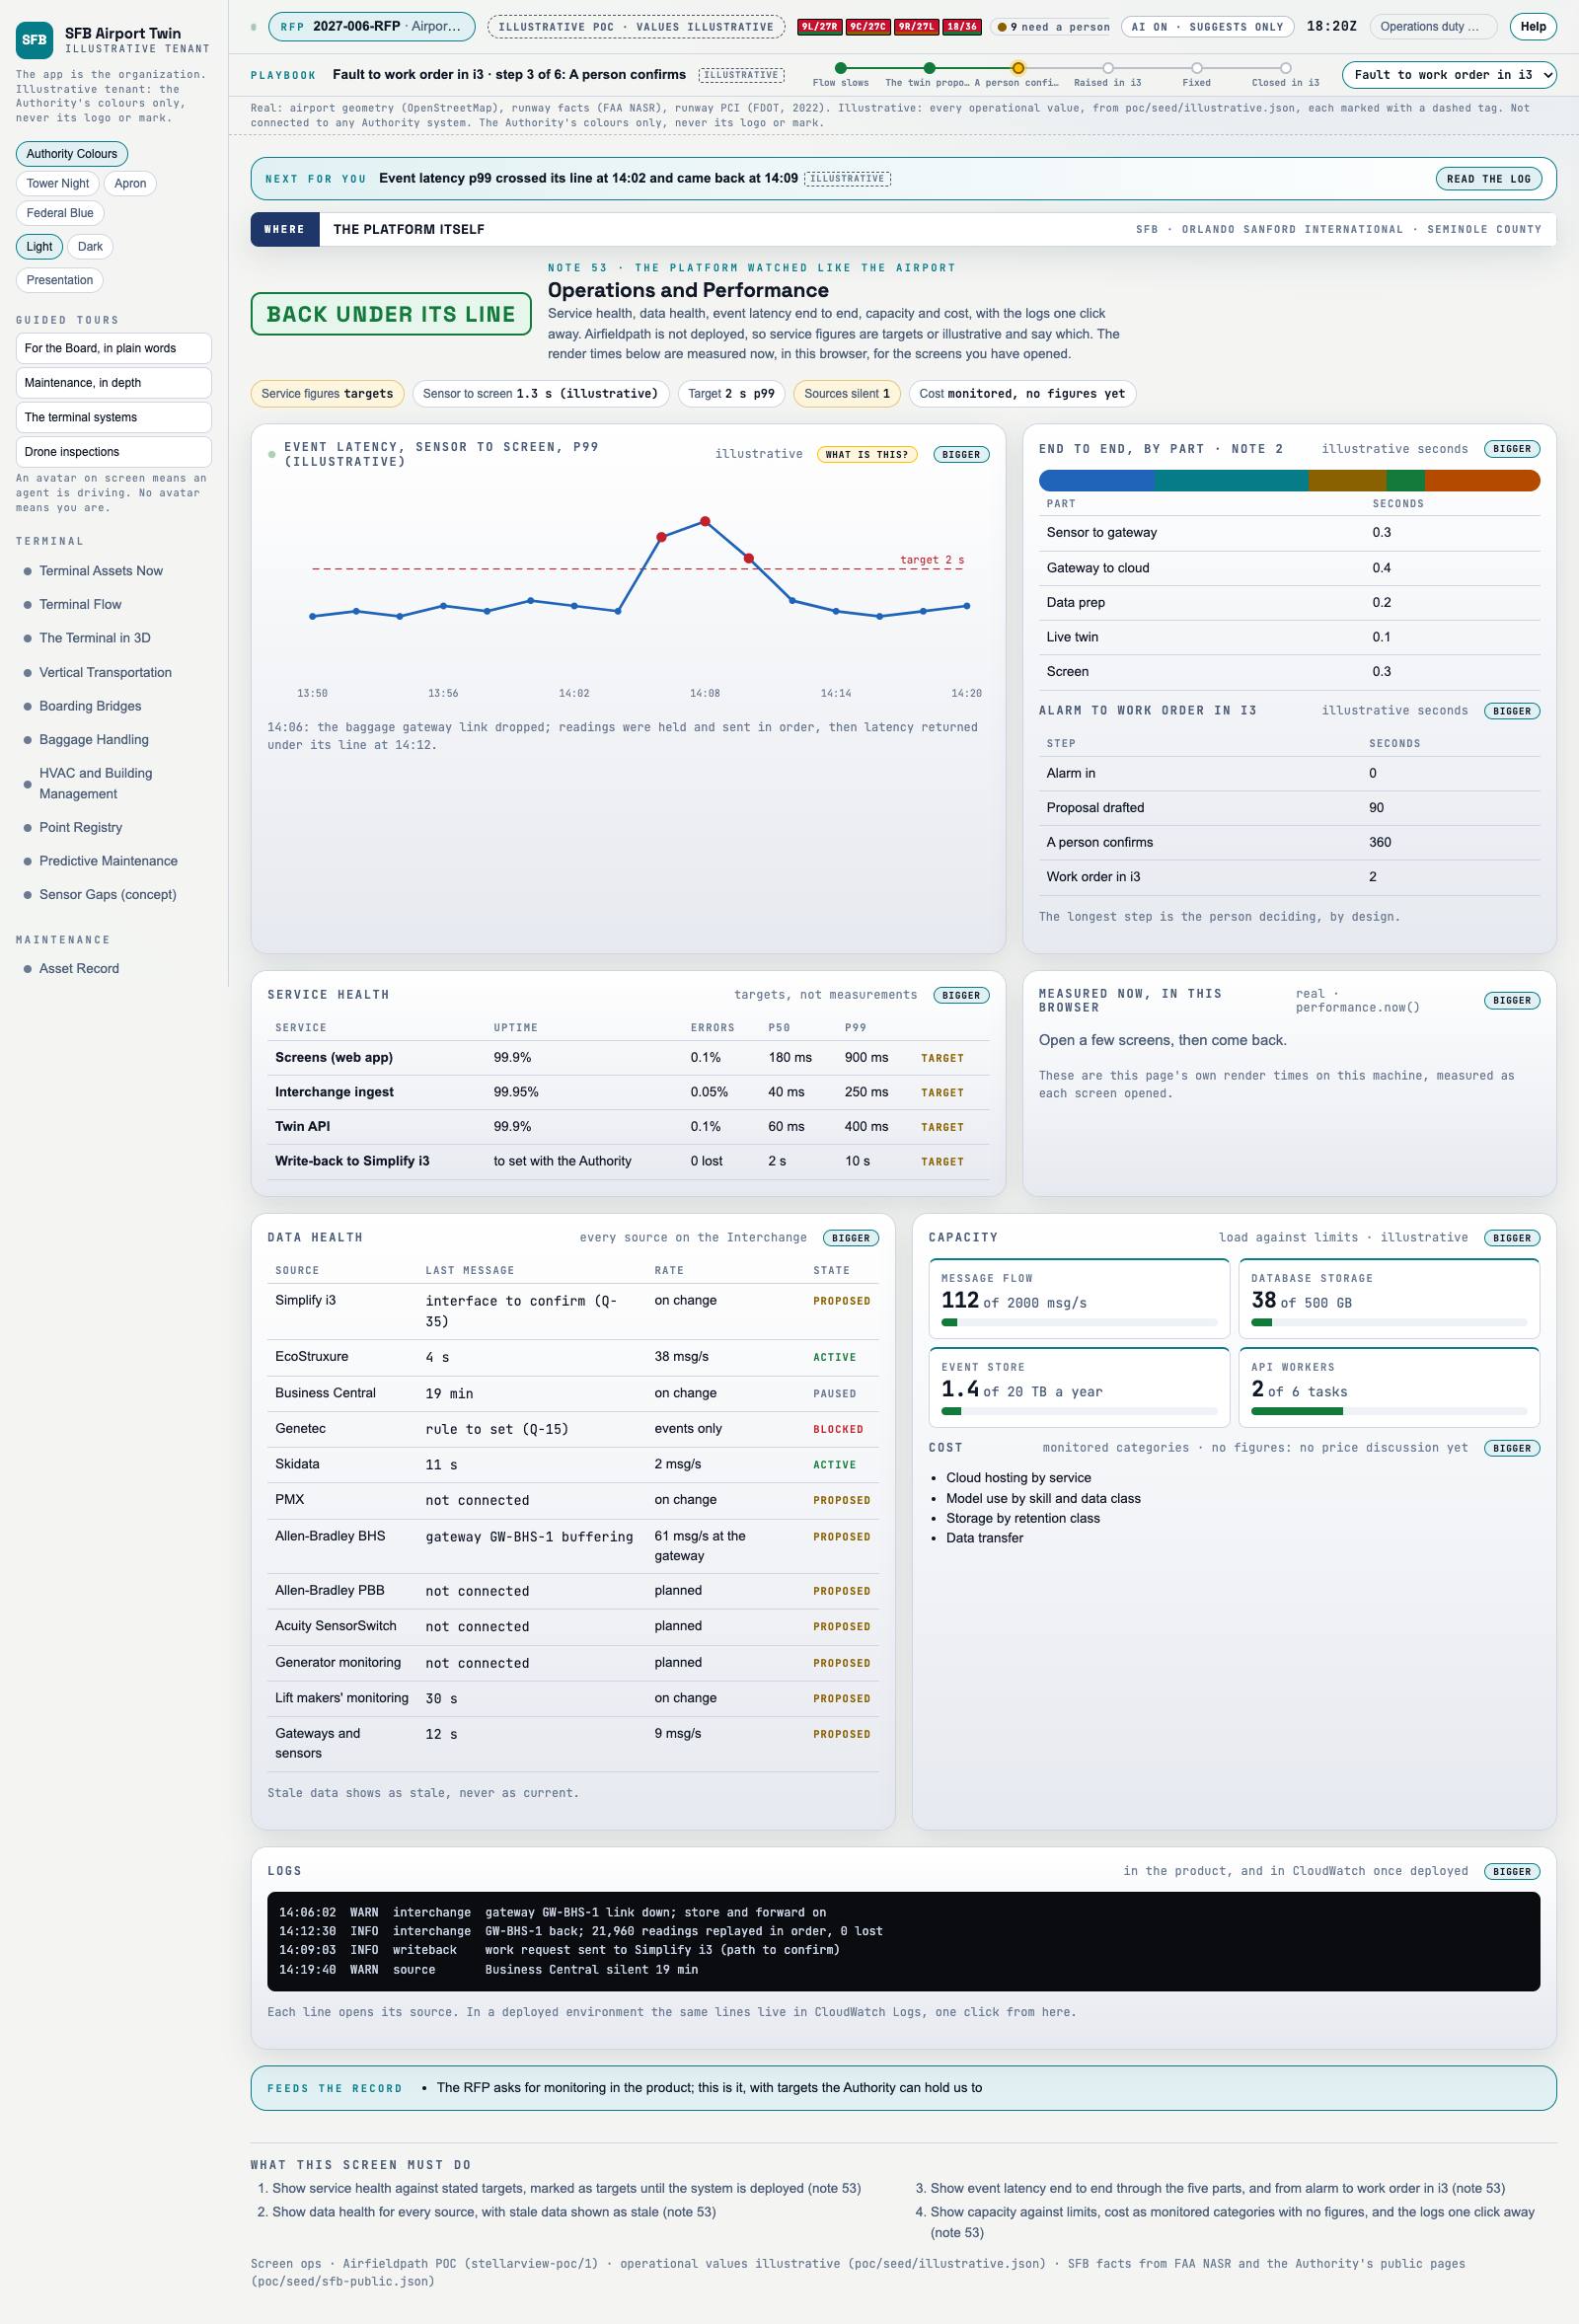 Capture of the screen: Operations and Performance. Dark and light modes.
Narration line
The service figures are targets until the system is deployed, and they say so.
Source: poc/bearings/ops.json, beat "Targets"
- Group
- Connect
- Status as the app labels it
- Real
- Basis
- The screen runs. Data: carefully crafted and curated test data for common use cases.
What the screen must do (4)
- Show service health against stated targets, marked as targets until the system is deployed
- Show data health for every source, with stale data shown as stale
- Show event latency end to end through the five parts, and from alarm to work order in i3
- Show capacity against limits, cost as monitored categories with no figures, and the logs one click away