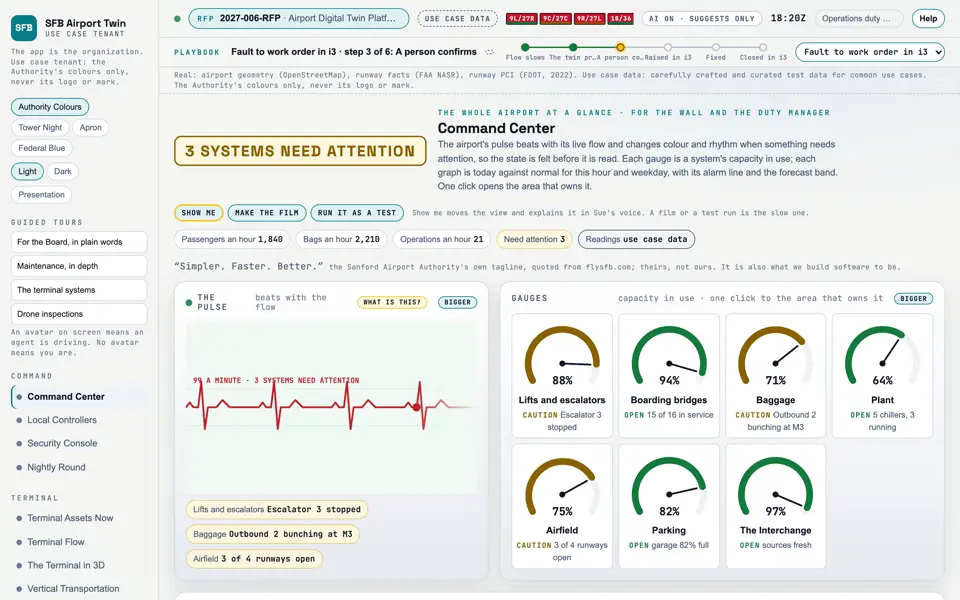
The whole airport at a glance: its pulse, a gauge for each system, and today against normal.
Picture: Headless capture of poc/index.html?v=command&m=light, as the proof of concept renders it, 1400 by 875 at 2x scale. Clip: Capture of poc/index.html?v=command&m=light, 4 seconds of the screen as it runs, 10 frames a second. No sound.
It shows the airport's pulse beating with its flow, changing colour and rhythm when a system needs attention.
Source: poc/bearings/command.json, beat "What it shows"
Group
Command
Status as the app labels it
Real
Basis
The screen runs. Data: carefully crafted and curated test data for common use cases.
What the screen must do (4)
Show the airport's pulse beating with the live flow (passengers, bags, operations an hour), changing colour and rhythm when a system needs attention (REQ-SFB-028)
Show a gauge of capacity in use for each system, each one click from the area that owns it (REQ-SFB-024, REQ-SFB-028)
Show trends against normal for this hour and weekday with alarm lines and the forecast band (REQ-SFB-028, REQ-SFB-037)
Open a local controller for each functional area (REQ-SFB-027)